The latest research shines a light on some of the world’s quickest-moving companies
One of the traits of an elite athlete is speed.
The very best out-pace their opponents, move across the field much faster, and react quicker than their peers. In 2021, the elite athletes of the corporate world are those who are more productive and efficient at making and selling their products and services. Their performance is recognized using a metric called Financial Cycle Time (FCT).
FCT measures how fast a company, on average, can turn investment into sales. It measures the ‘how often’ of a business. To understand its significance, consider an example from the retail sector. In 2020, Walmart made a pre-tax profit of 4.8% on sales, while competitor Costco, selling a similar product, made only 3.6%. Walmart is the clear leader when it comes to profitability between the two and makes more money when they sell their product. This is the ‘how much’ of business.
That difference becomes a competitive advantage. This is where speed matters.
The pandemic’s impact
The impact of the pandemic on business will be felt for some time. Many businesses have been hugely disrupted and many consumer behaviours have changed, sometimes radically. One major trend has been the accelerated shift to online. Companies that had a multi-year roadmap for online strategies compressed their plans into days and weeks in April and May 2020 as the world shut down.
The most nimble companies have adapted well. In the US, FCT Gold Award-winning specialty retailer Best Buy suddenly had a new business model, with customers no longer allowed in their stores under tight Covid restrictions. They responded quickly with an omnichannel approach which combined e-commerce with ‘drive-up pickup’ collection from store sites. Their FCT of 32 days was best in class for retail in 2020.
Not every sector had the same options for adaptation. The travel industry suffered as governments issued ‘shelter in place’ or lockdown orders, and borders were closed. In the US, airline passenger volumes plunged by 70%. Many planes were parked in the desert with no places to fly. Southwest Airlines saw its FCT slow to 557 days as it scrambled for cash to meet short-term liquidity requirements – but its speed lessened the blow compared to peers such as American Airlines, which saw its cycle time slow to 760 days. European budget air carriers Ryanair and Wizz Air led their markets with cycle times of 246 and 250 days respectively.
In the European clothing (apparel) market, JD Sports outpaced fast fashion retailers Inditex, owner of Zara, and H&M to earn gold with the fastest cycle time, 168 days. JD Sports benefited from its global expansion in India and Asia: it has ridden the ‘athleisure’ wave successfully and maintained sales levels despite the pandemic.
Understanding FCT
Company A has a productivity ratio of 0.8 and their competitor has a ratio of 0.6. Which is better?
To answer the question, you need to understand how productivity ratios are calculated and be familiar with the terms involved. But consider this statement: in 2020, Adidas could build and sell products in 115 days, while Puma took 137 days. Which is better? Here, it is apparent that Adidas is the faster company. The lesson is that language matters – and that is one of the benefits of FCT as a metric. It is intuitive.
Another benefit stems from the fact that FCT estimates the cycle of the entire company rather than just its working capital. It includes investment in inventory, receivables and payables as well as investment in property, plant and equipment, plus any investments in intangibles such as goodwill.
To calculate FCT is simple enough. Take the total investment of the business and divide it by annual sales to get the percentage of a year it takes to sell that investment. Multiply the result by 365 days and you get the business’s overall FCT.
Production cycle time
Another metric of productivity is Production Cycle Time (PCT). PCT is related to FCT, but the main difference is that PCT only looks at the investment in property, plant and equipment (PP&E) and core working capital, while FCT looks at the investment of all operating investments. PCT measures the core.
Take the example of the global defence and aerospace firm, Lockheed Martin. In 2020, it had an FCT of 77 days – but if you looked at only the investment in receivables, inventory, payables and PPE, its cycle time was just 17 days. Much of the difference was from investments in other assets such as goodwill, which is the premium paid as a result of acquisitions.
Another segment with a large difference between FCT and PCT is the soft drinks industry. PepsiCo and Coca-Cola both add about 100 days of time to their PCT through financing their various acquisitions. Coke bought Costa Coffee for $5.1 billion in 2019, for example, while PepsiCo bought Rockstar Energy Beverages for $3.9 billion and South African food company Pioneer Foods for $1.7 billion in 2020.
How does this affect cycle time? When a company makes a large acquisition, it adds a premium for the acquired assets to the balance sheet, called goodwill. That additional investment needs to be recovered – and it can be measured by the increase in cycle time for a company. This is one of the reasons that synergies become so important in acquisitions.
Companies which focus exclusively on organic growth, such as Costco, have no differences between their PCT and FCT. At the other end of the scale, pharmaceutical firm GlaxoSmithKline added 113 days – almost four months – to its cycle time primarily due to its spending on acquisitions.
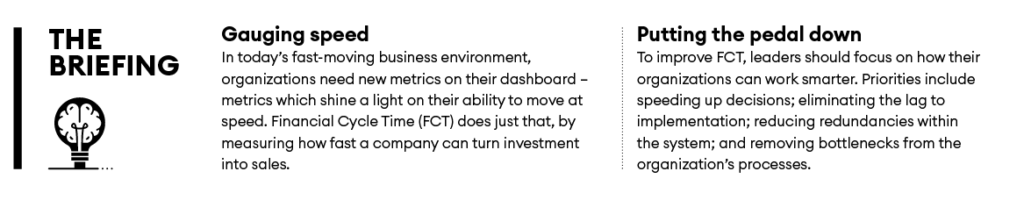
Improving FCT
Have you ever been in an inefficient meeting? What was the cost of that meeting? Take the number of people, multiply by their hourly pay and then multiply by the time of the meeting in hours. Then consider the sheer volume of meetings. Inefficient meetings can be looked at as a very large investment that adds time to a process.
To improve cycle time, a company should focus as much on working smarter as it does on working harder. Eliminate the white space between decisions. Reduce redundancies within the system. Remove bottlenecks from processes. It is the perspective of the agile organization.
There are limits, of course. Some companies can move too fast. Improving FCT is not a licence to cut corners, compromise safety or quality, or to be reckless. Speed can be dangerous. That is arguably the cautionary tale of Bronze award winner Boeing and the challenges it has faced over recent years with its 737 Max investments. Boeing was widely seen as being under pressure from rival Airbus to speed up its delivery of a next generation plane – and after an accelerated development schedule, the 737 Max experienced numerous design and safety challenges.
Companies need to focus on working smarter. If they can sustainably deliver their processes with quality and reliability, faster than their peers, it can be a source of competitive advantage.
Case study: Nike sprints into the lead
In 2017, Nike launched its ‘Consumer Direct Offense’, aiming “to better serve the consumer personally, at scale”. The initiative incorporates Nike’s ‘Triple Double’ strategy: “2X Innovation, 2X Speed and 2X Direct connections with customers.” This meant “accelerating the impact and cadence” of new innovation platforms, moving from seeding to scaling a lot faster. It aimed to cut production cycles in half: Mark Parker, then chief executive, said that doubling the firm’s speed “is really all about delivering the right product in the moment, 100% of the time”. And to increase its direct connections with customers it would invest heavily in its digital channels.
The results have been impressive. In the 2021 Duke Corporate Education productivity awards, Nike is the Gold winner in the apparel, or clothing, segment, with a Financial Cycle Time (FCT) of 128 days. The closest US competitor was Hanesbrands, at 176 days; in third place was Under Armour, at 183 days.
Nike’s speed is no fluke. It is the result of deliberate choices to implement digital technology, boost supply chain innovation, and adopt agile principles.
Investments in digital
The coronavirus pandemic has seen Nike accelerate its transition towards digital. Pre-Covid, Nike was planning that 30% of its sales would be online by 2023: it has now raised that target and is aiming for over 50% of its sales to be online by 2023.
Nike’s investments in digital have included several acquisitions. In 2018, it acquired Zodiac, a data analytics provider that helped drive marketing insight and mobile app conversion. In 2019, it bought Celect, a company focused on predictive analytics and demand-sensing tools which aid understanding of the supply-demand relationship, improve allocation, and manage pricing more efficiently. And in 2021, Nike acquired data integration platform provider Datalogue, to help it analyse consumer data and speed up decision making. This could improve Nike’s information on customers’ buying frequency, basket sizes and retention rates – key insights as it does more direct-to-consumer business.
Andy Campion, Nike’s chief financial officer, has said: “We’re leveraging our Nike membership platform and Nike mobile app ecosystem to inspire and enable people to be active at home, while also providing targeted product offers and services to customers.” These digital investments enhance Nike’s ability to build deeper connections with its users.
Speed wins the race
Another part of the Consumer Direct Offense, Express Lane, was launched with the goal of bringing new products to market faster. Nike wanted to shorten its traditional supply chain and reduce production time by 50%. Products in the express lane system can now move from design to delivery in under six months, which is three to six months faster than the traditional process.
The company has also invested in RFID technology to tag all of its footwear and approximately 75% of its clothing, providing a better view of inventory in real time. This provides the flexibility to make better product decisions and improve profitability. It allows Nike to adapt to changes in the market at an accelerated rate.
What’s next?
Nike is not done with the race for speed. It has set its sights on several new market opportunities to focus its streamlined business. It is looking to use its efficient supply chain to refresh its sub-$100 range of footwear, providing more choice at an entry-level price point – and it is also increasing its focus on women’s clothing.
Whatever market it chooses to enter, speed will be a critical differentiator and driver of innovation for Nike in its race against the real competition: itself.
